How Dutch Investors Use Heatmaps to Track Market Sentiment
Market sentiment is a crucial element for investors when making well-informed investment decisions. When analyzing the market, Dutch investors depend on heatmaps to evaluate the behavior of markets and discover new developing trends because they adopt an analytical investment standpoint. Heatmap data visualization enhances market sentiment analysis by showing buying and selling intensity patterns to investors. The visualization enables investors to detect main market tendencies before reacting to single price changes, thus allowing effective investment decisions.
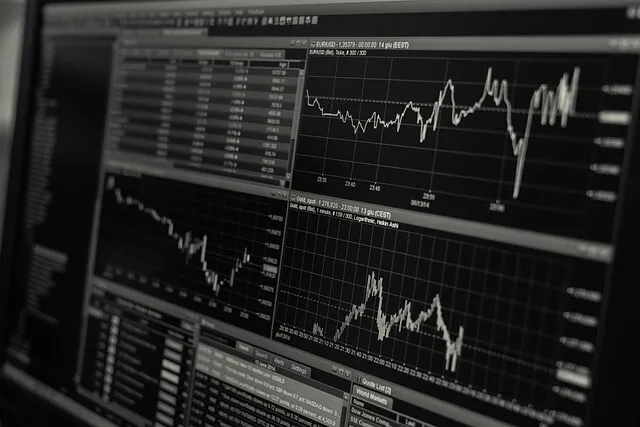
Complex data drawings benefit from color gradients because they show varying levels of activity through different hues. A significant increase in demand is shown as vibrant green clusters, while widespread selling generates dark crimson clusters on the graphs. Through the visual format, it becomes simpler to recognize patterns which are not apparent in traditional charting systems. Across the Dutch investment landscape, this data visualization tool helps investors monitor sector performance, gain insight into market capital flows, and differentiate between optimistic and fearful markets. These financial tools enable investors to capture market trends around price movements through macro-level observation instead of focusing on individual prices.

Image Source: Pixabay
The speedy movement of market sentiment requires investors to respond immediately because doing so creates a competitive advantage. The Heatmaps system lets investors track which assets receive maximum attention together with the developing areas of market pressure. When multiple sectors simultaneously display red indicators, the market may face widespread correction; however, isolated red sections show temporary market downturns. Dutch investors who identify market patterns early gain an advantage to seize profitable prospects before others notice them.
Modern charting platforms simplify heatmap analysis by providing access to this method for daily trading strategies. TradingView Charts features an adaptable heatmap function that displays volume activity as well as liquidity points together with market balance indicators. Dutch investors gain enhanced decision-making power for their market entry and exit planning due to their access to real-time data through this analysis. Heatmaps enable investors to verify their trading assessments while acquiring solid trading confidence.
Market sentiment often emerges from institutional activities which heatmaps effectively provide the ability to monitor. Market price moves in short time periods when substantial purchase or disposing orders create unbalanced conditions between supply and demand. Investors looking to understand institutional investment behavior should monitor specific regions in the market since they reveal how institutions position themselves. Dutch investors gain better market awareness so they deploy their strategies which match current market movements rather than fighting against existing market trends. The tracking of distribution or accumulation phases by heatmap analysis helps traders discover important signs of trend reversals.
Heatmaps serve valuable purposes in managing risks in investment strategies. Investors face increased price movements unless they fully grasp market directional trends. When Dutch investors use heatmaps as part of their trading strategy, they can protect themselves from entering against-market trades. The surrounding red area on the sector heatmap indicates market trends that may hide potentially weak performance of a stock with otherwise strong traditional chart characteristics. The supplementary verification system reduces the risk of making rash decisions while improving overall risk management.
The evolution of market analysis technology along with TradingView Charts platforms provides Dutch investors with valuable sentiment tools through heatmaps. Market visualizations through structured methods help Dutch investors to make more precise choices in uncertain situations. Automation of real-time buying and selling data enables investors to better foresee market movements and find chances while handling potential risks. Through employing heatmaps, investors get a strategic market perspective which helps them make decisions based on complete market sentiment understanding rather than short-term price movements.
Comments